The AppInsights SDK is quite simple to integrate with and provides rather rich functionality and extensibility, but it is now considered a “legacy” - Azure team announced focus switch to support OpenTelemetry:
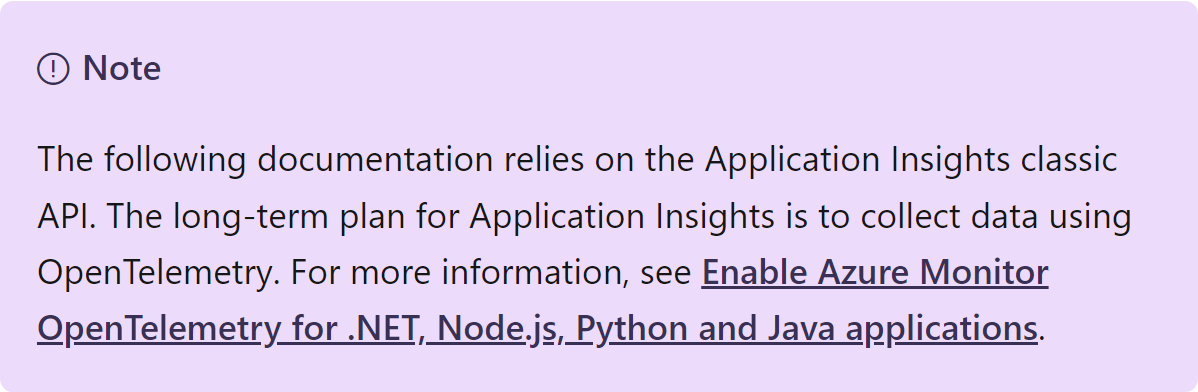
So, we should switch to using Azure.Monitor.OpenTelemetry.Exporter. That’s not a bad thing by itself, but there are not many guides on the migration process, especially for console applications like mine, and the Azure Exporter doesn’t support a lot of useful things I got used to. Also, it’s quite a shift in how things work and how they are named, so I decided to list the problems I faced and my solutions to them.
But before you even begin…
Do NOT migrate if:
- You want to use custom events: they are still in feature request
- You annotate logs or metrics: there were many issues, now consolidated in one big feature request for Custom Resource Attributes
- You use “default” attributes like SessionId or UserId
Looks like all these feature requests stay unresolved for a very long time and I’m not sure they will be resolved any time soon, so my main applications will stay on, as they say, “Classic” ApplicationInsights SDK.
So why did I migrate?
Apart from my main applications, I have some utility .NET Console applications, that need to be in the form of self-contained single-file not-so-big executables. The last requirement about size is not that easy to achieve, since the executables need to have all the power of .NET and referenced packages to do their job.
Luckily, modern .NET has Trimming and Native AOT, which can make the task not that difficult. The problem is, that “Classic” ApplicationInsights SDK does not support trimming and AOT and will never do. On the other hand, Azure.Monitor.OpenTelemetry.Exporter already supports trimming and AOT.
Also, I did not know about the pitfalls I mentioned before and wanted to stay up-to-date, so I thought “Why not?” and began.
Basic setup: first run and first problems
Probably you’ve seen some basic tutorials on enabling OpenTelemetry. I needed only logs, so I also read some OTel SDK documentation and came up with this for my app with Dependency Injection:
ResourceBuilder resourceBuilder = ResourceBuilder.CreateDefault()
    .AddService("MyApp", null, "1.0", false, Environment.MachineName);

services.AddLogging(builder =>
    builder.AddOpenTelemetry(options =>
    {
        options.SetResourceBuilder(resourceBuilder);
        options.IncludeFormattedMessage = true;
        options.AddAzureMonitorLogExporter(o => o.ConnectionString = myStr);
    });
That gave me some logs in the Application Insights dashboard, hooray! However, my happiness did not last long, I noticed that log entries were not linked together in any way, so I was not able to identify what instance and what session produced the log message I saw. In other words, logs were not correlated. I read the document about OpenTelemetry Log Correlation and found this phrase:
The good news is that, in OpenTelemetry .NET SDK, there is no user action required to enable correlation
Other words did not make much sense to me. I assumed if no user action is required, then SDK does all that’s needed, including creating these strange “activities” and so on. Boy, how I was wrong.
Finding missing correlation
Differences between ApplicationInsights SDK and OpenTelemetry Exporter
Apparently, the OpenTelemetry data model differs quite significantly from the “Classic” AppInsights. In Classic AppInsights SDK, we had:
- Traces - basic log entries (data points)
- Dependencies - log entries of a special type to track calls to APIs or databases
- Exceptions - log entries with details about exceptions
- Custom Events - the special type of log entries for tracking significant actions
- Requests - operations, that can include all of the data points mentioned above
There are also metrics and other things, but they are not relevant for a console app, so I’ll skip them.
AppInsights SDK sent all logs I put into ILogger instances to traces, and I was able to click on arbitrary trace and get all the available telemetry for this session, which was immensely helpful.
If a log message had an Exception, it appeared as an Exception in the AppInsights portal.
Dependencies were collected automatically, and I manually annotated code with the Custom Events and Requests (Operations) I needed.
In OpenTelemetry, apart from metrics, we have:
- Logs
- Traces
That’s all. The funny thing here is that Traces here have a completely different meaning from Traces in the Classic AppInsights. Thank God Logs are still Logs.
Understanding OpenTelemetry traces
So, coming from AppInsights SDK, Traces are similar to Operations or Requests. This is an entire process, for example, “Loading user’s dashboard on a portal” or “Updating stand-alone installation of the main app”. Since the trace is a “full path of a request”, as opposed to AppInsights’ Requests, we can’t have parent and child traces, that would be strange. Instead, there are spans. So a trace has a root span and zero or more child spans:
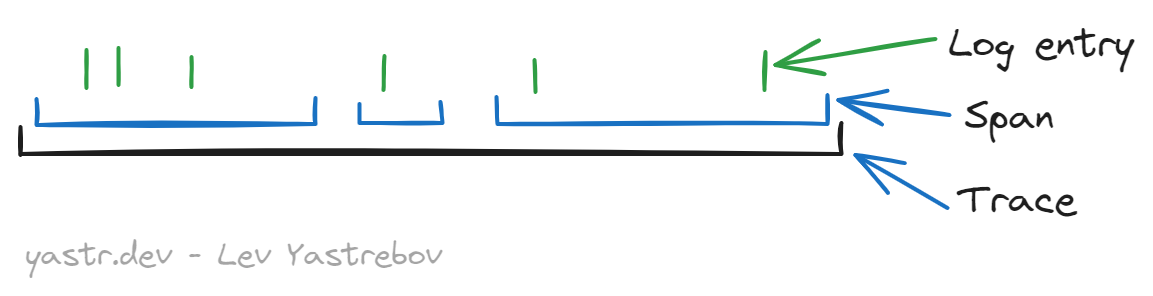
In other words, spans are also Requests or Operations, since the latter ones can also be nested.
So why do traces exist if they must have a root span anyway? To make that possible:
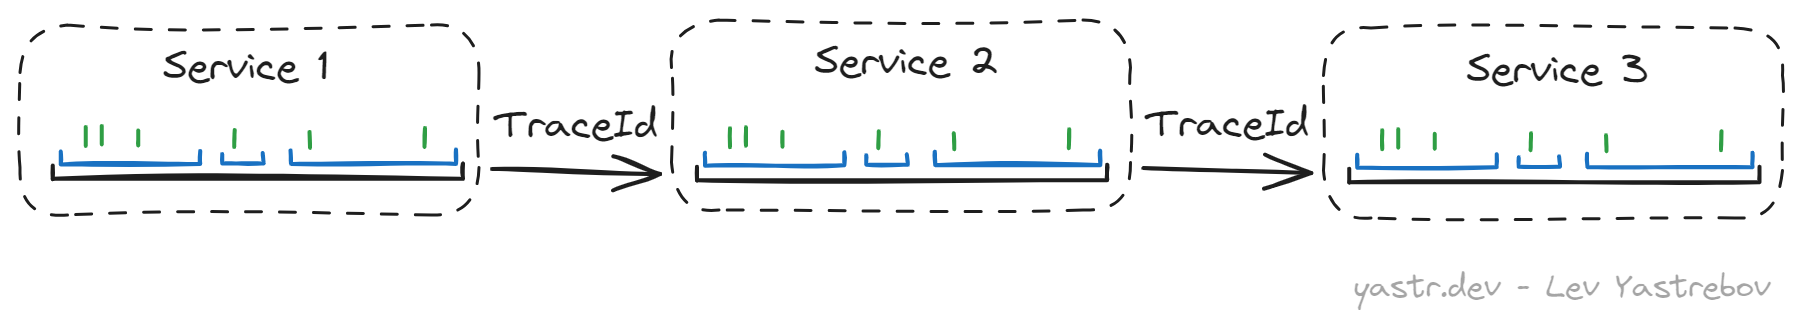
Here we have 3 distributed services, they will have their spans, but by setting them all the same TraceId we have now our “full path of a request”.
At this point, you are ready to read the trace docs on that matter, if you’d like.
Setting up OpenTelemetry logs with correlation
In OpenTelemetry, logs are not automatically correlated by SessionId like it was in AppInsights, they require a trace with a span. But if you will follow OTel modification guide and add this code:
var tracerProvider = Sdk.CreateTracerProviderBuilder()
    .AddAzureMonitorTraceExporter();
or this, from other instruction:
var tracerProvider = Sdk.CreateTracerProviderBuilder()
    .AddSource(serviceName)
    .AddAzureMonitorTraceExporter()
    .Build();
Then… nothing will happen. That does not work that way. And that serviceName is not just the name.
Azure.Monitor.OpenTelemetry.Exporter relies on some .NET library types to work, namely System.Diagnostics.ActivitySource and Activity. This is how it works:
Define a string
activityName. This is the application-level unique identifier of the, let’s say, event stream. That might be even a GUID.Create an
ActivitySourceproviding this name:new ActivitySource(activityName)- in case of DI:
services.AddSingleton(new ActivitySource(activityName))
Under the hood, that registers this source in a static collection of active sources.
Create that
TracerProvider, passing that exactactivityNameas aSource:Sdk.CreateTracerProviderBuilder().AddSource(activityName)Under the hood, when instantiated, this
TracerProviderwill add itself as a listener to that event stream akaActivitySource.Use the
ActivitySourceyou’ve created toStartActivity:using Activity? activity = services .GetRequiredService<ActivitySource>() .StartActivity("Getting things done");
You’ve done a lot already. But you will still not see logs correlated nicely into Operations. Funny, huh?
This is the last piece. To understand, what kind of TelemetryItem to send to the Application Insights ingestion point, the Exporter’s code does this check (shortened for brevity):
internal static TelemetryType GetTelemetryType(this Activity activity) =>
    activity.Kind switch
    {
        ActivityKind.Server => TelemetryType.Request,
And only in the case of TelemetryType.Request TelemetryItem’s code sets the carefully specified activity name.
So, a proper activity start looks like this:
using Activity? activity = services
    .GetRequiredService<ActivitySource>()
    .StartActivity("Doing stuff", ActivityKind.Server);
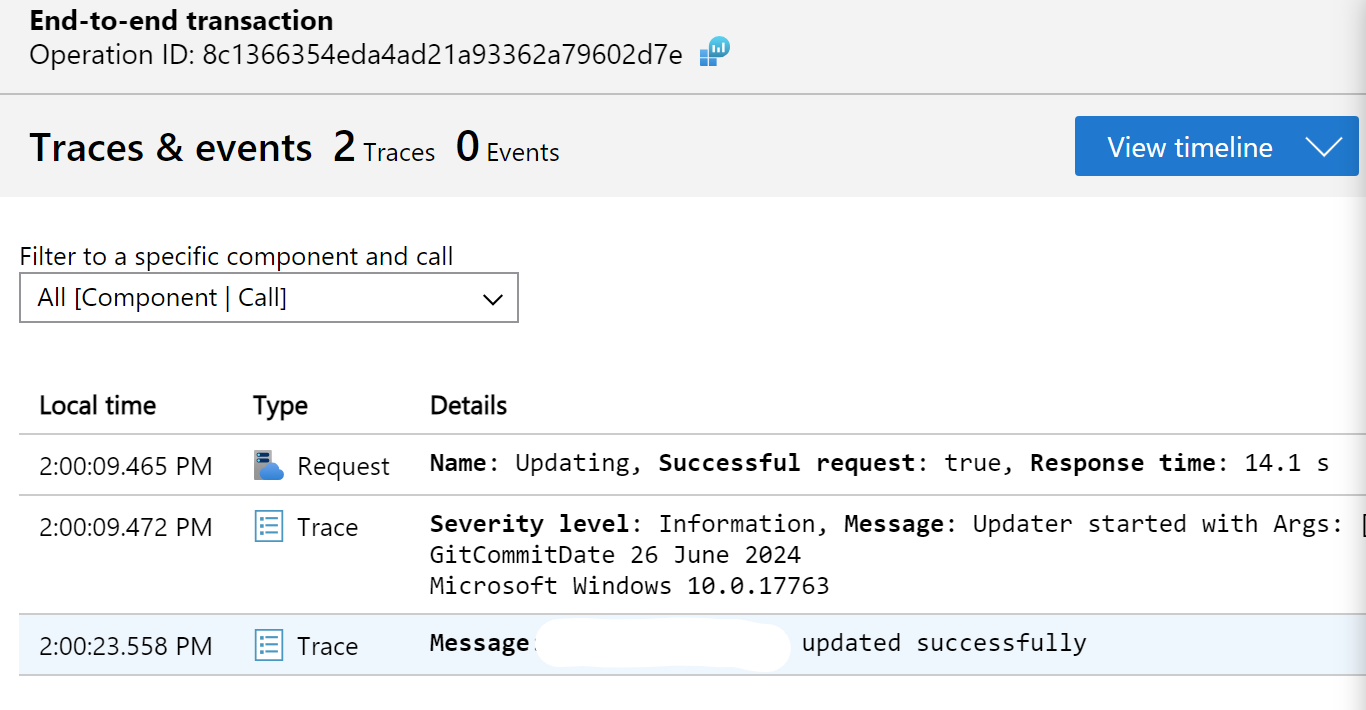
Finally, you will have nicely correlated logs and by clicking on any log enty I see the full trace, as OpenTelemetry names it:
The cherry on top - DI-friendly initialization
Examples I found were tailored either to console apps with static Sdk.Create ..., while I prefer to use DI for that utility, or to AspNetCore usage with DI, but also with a ton of stuff I don’t need. I managed to find my solution in the OpenTelemetry.Extensions.Hosting package, here’s my full code:
private const string _activityName = "MyFinallyWorkingActivity";
private const string _aiStr = "<your string here>;";

public void ConfigureTelemetry(IServiceCollection services, string appName)
{
    services
        .AddSingleton(new ActivitySource(_activityName))
        .AddOpenTelemetry()
            .ConfigureResource(b => b.AddService(appName))
            .WithTracing(b => b // Tracing correlates logs by setting TraceId
                .AddSource(_activityName)
                .AddAzureMonitorTraceExporter(o => o.ConnectionString = _aiStr))
            .WithLogging(_ => { }, o =>
            {
                o.IncludeFormattedMessage = true;
                o.AddAzureMonitorLogExporter(ao => ao.ConnectionString = _aiStr);
            });
}
You may see the option to add resource attributes, but that’s ignored in logs, unfortunately. You can only put them to activities like I do in the initialization phase:
private static readonly string _sessionId = Environment.UserName +
    "-" + DateTime.UtcNow.ToString("yy-MM-dd-HH-mm", CultureInfo.InvariantCulture);

public Activity? Initialize(ServiceProvider services)
{
    // We need to instantiate providers, so they will subscribe to the ActivitySource
    services.GetRequiredService<TracerProvider>();
    services.GetRequiredService<LoggerProvider>();

    // And now we can create a valid activity
    Activity? activity = services.GetRequiredService<ActivitySource>()
        // Server - so this will go to Request in AppInsights
        .StartActivity("Updating", ActivityKind.Server);

    activity?.SetTag("session.id", _sessionId); // Goes to custom properties
    return activity;
}
The extension method AddOpenTelemetry() also creates IHostedService, so you can Start it and it will instantiate the providers the same way we did, but this is not suitable semantic for my case, so I decided to just write these 2 lines of code with GetRequiredService.
I use this initialization in the Main method of my Program.cs:
using Activity? activity = telemetryConfigurator.Initialize(serviceProvider);
That way it covers all the lifetime of my utility.
Wrapping up
For now, you should be well-equipped for the migration, if you decide so.
Together, we:
- Understood, whether this migration is needed
- Set up log correlation
- Initialized the exporter via DI
Please, let me know if that helped you or if you see something that can be improved - your feedback is very valuable to me.
Have a question or something to say? Leave a comment ↓
Connect with me, hire, or just drop a message